
Compare performance across campuses.
EDHI5 Analytics & DashboardsSee Clearly.
See Clearly.
Decide With Confidence.
Bring campus information into focused dashboards—from daily priorities to institution-wide performance.
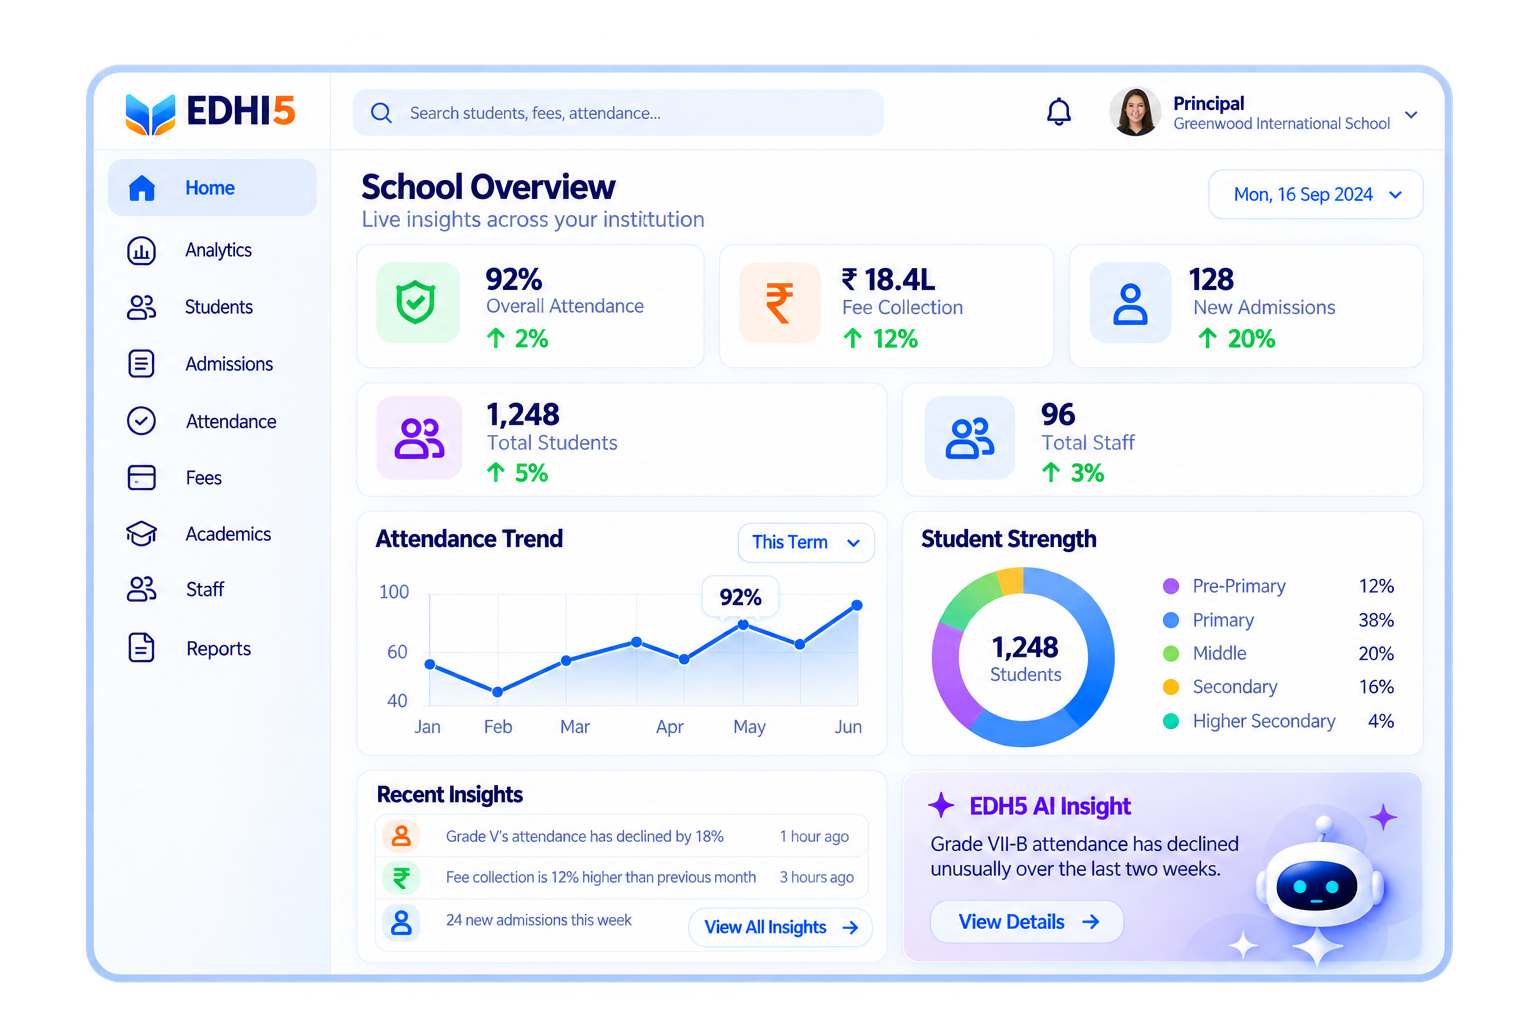
Relevant VisibilityConnected InformationData-Driven Decisions
From Overview To DetailOne Connected View.
One Connected View.
Every Level Of Detail.
Move from institution-wide oversight to the records behind each result. Understand the bigger picture, then explore the campus, grade, class or student context.
Review individual campus performance.
Understand grade trends and outcomes.
Review attendance and academic priorities.
Explore individual progress and records.
Built Around Responsibilities
Different Roles. Relevant Answers.
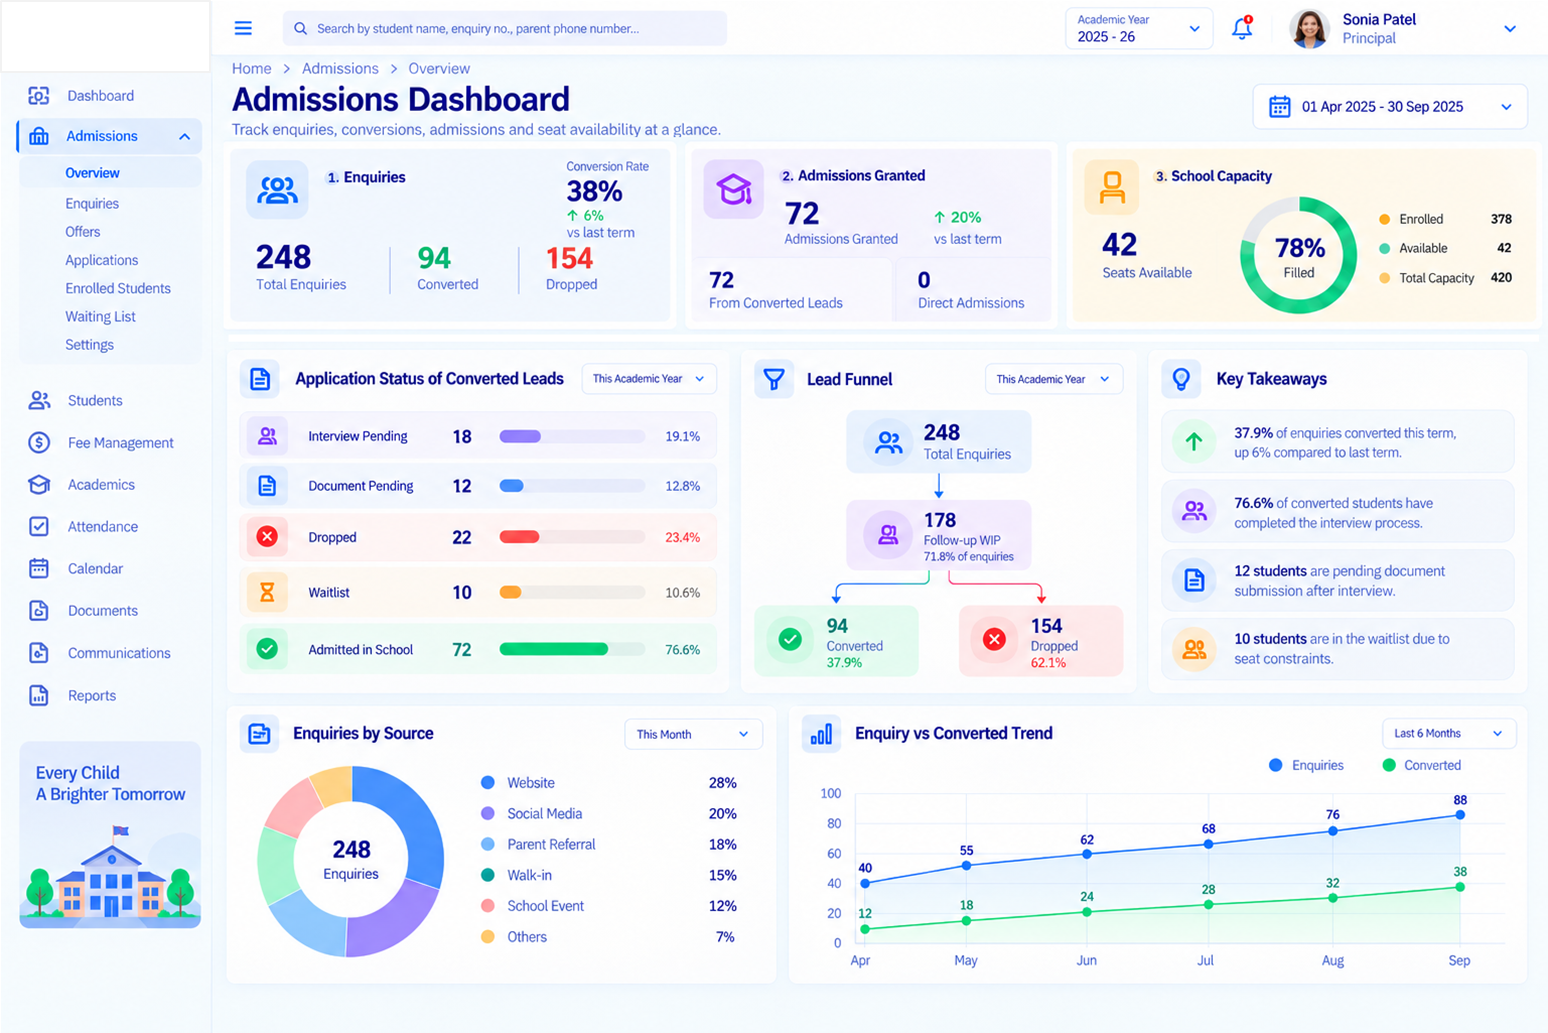
Leadership sees performance and priorities. Teams see the information needed to move daily work forward. Explore the supplied dashboard previews below.
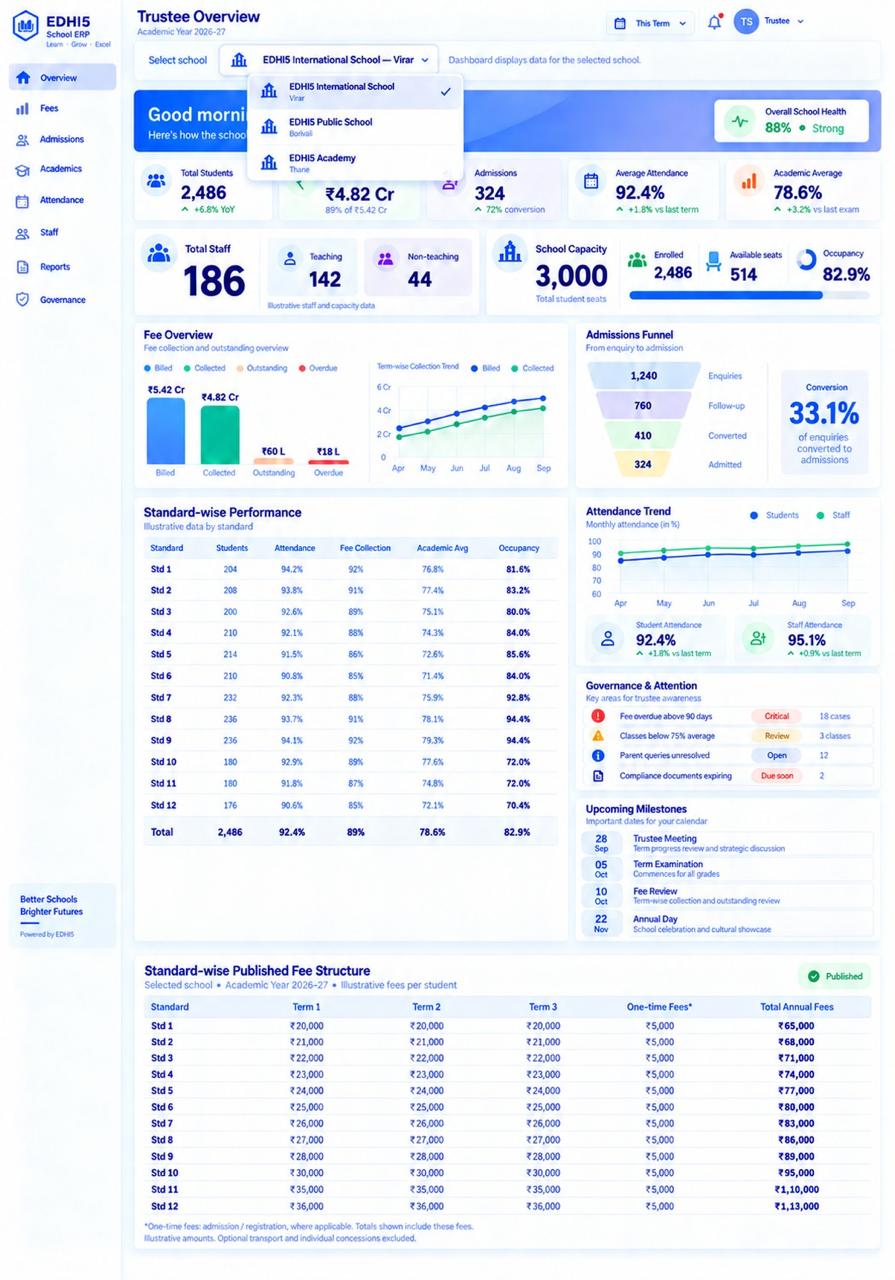
Management Dashboard
See The Institution In One View
Review campus performance, capacity, occupancy, staffing, admissions, collections and governance priorities.
- Campus Comparison
- Capacity & Occupancy
- Published Fee Structure
Principal Dashboard
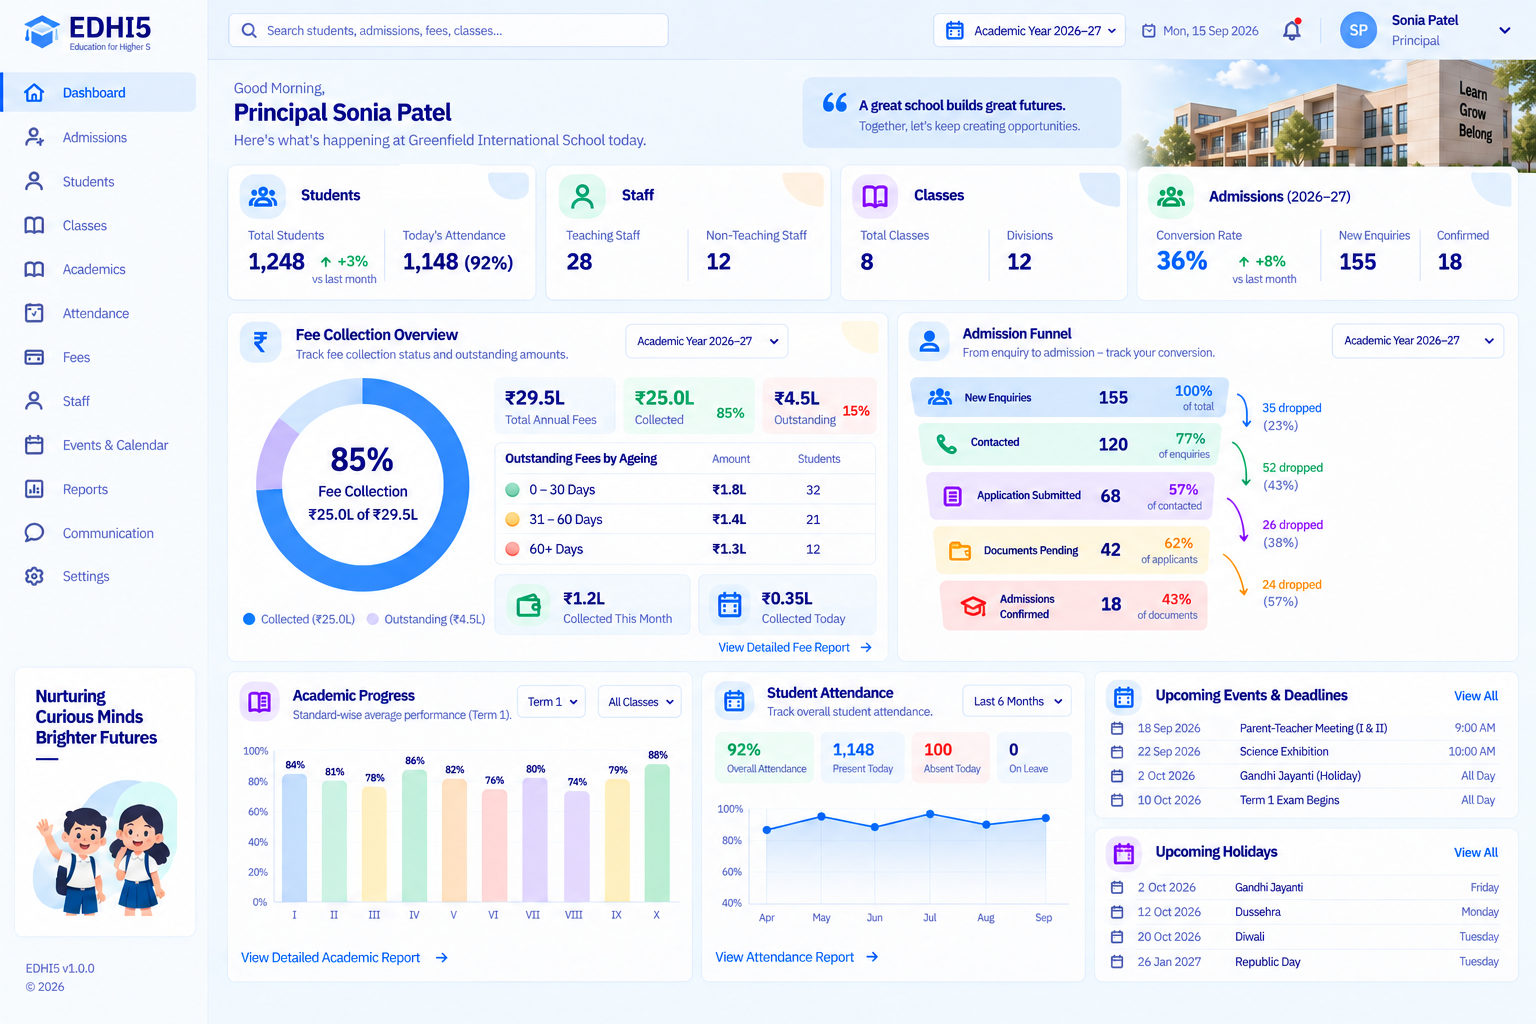
Know What Needs Attention Today
Bring students, staff, classes, fees, admissions, academic progress and attendance into a focused campus overview.
- Campus Overview
- Academic Progress
- Daily Priorities
Accountant Dashboard
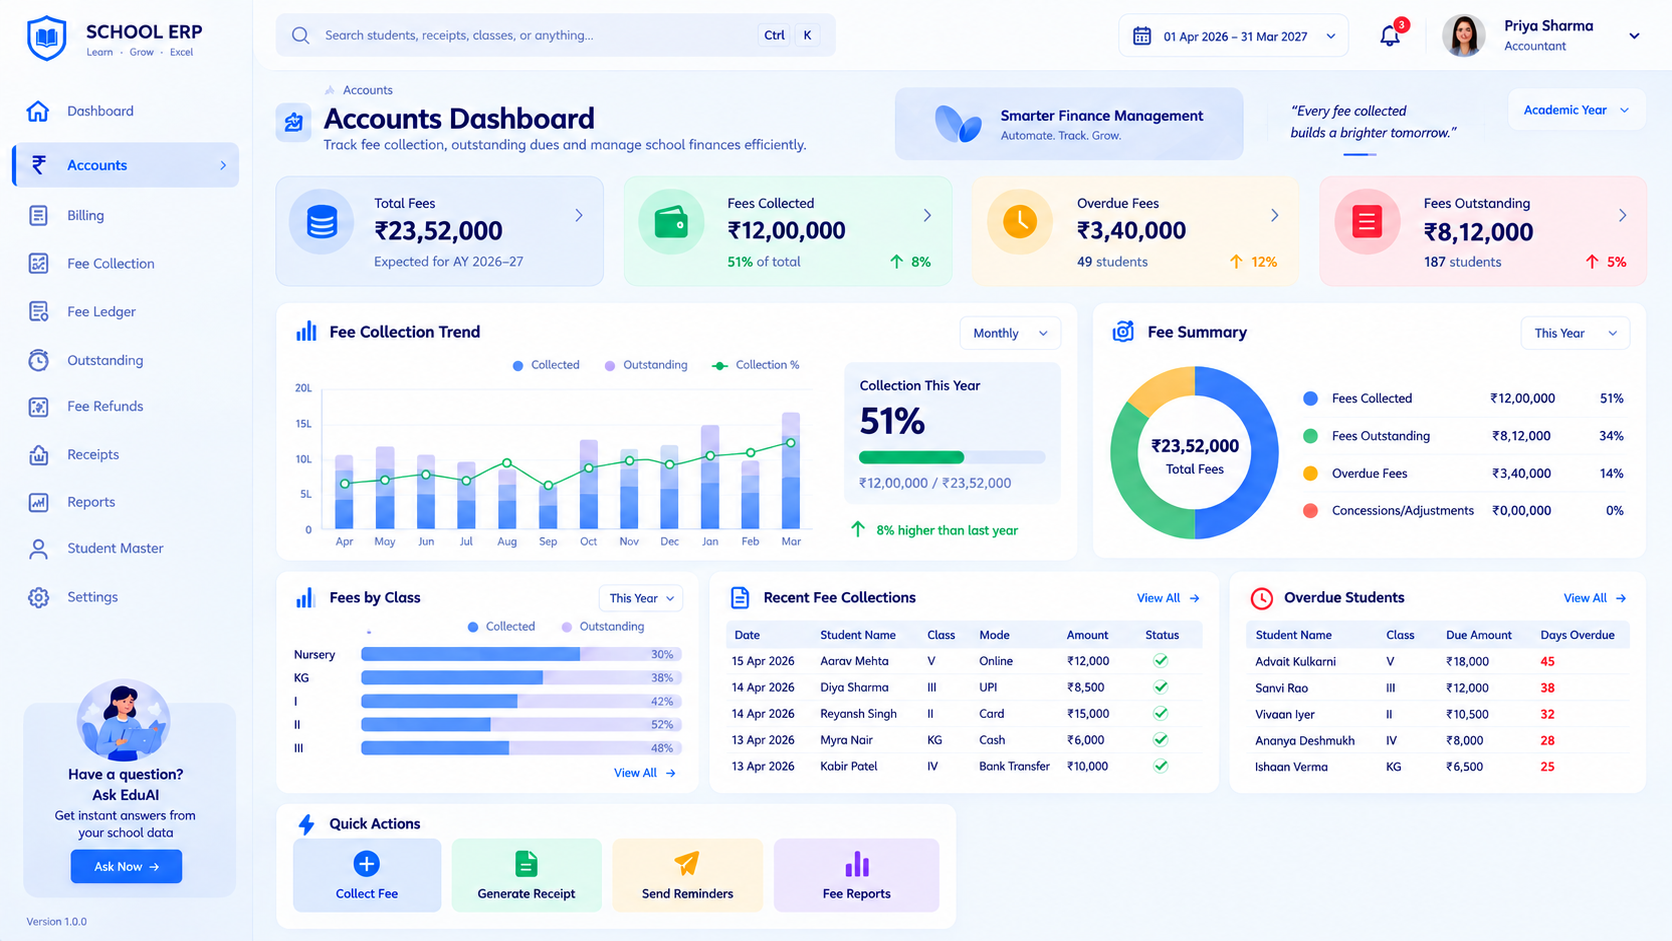
Collect With Greater Control
Review total fees, collections, outstanding and overdue balances, with class-wise reporting and student fee records.
- Collection Trends
- Outstanding Balances
- Overdue Fees
Admissions Team Dashboard
Keep Every Enquiry Moving
Review enquiries, follow-ups, applications and confirmed admissions alongside campus capacity.
- Enquiry Funnel
- Conversion Trends
- Pending Follow-Ups
✓ Role-Based AccessConfigured permissions shape what each user can view and act on.
Key Areas Of Campus PerformanceThe Information Behind
The Information Behind
Better Decisions.
Understand attendance, admissions, collections, capacity and academic performance through focused views.
Attendance Trends
Track patterns by period, grade and class to understand where attendance needs attention.
Admissions Funnel
Follow enquiries, applications and confirmed admissions through the admission journey.
1,000 Enquiries
600 Applications
240 Admissions
Fees & Collections
Review collections, outstanding balances and overdue fees with relevant reporting.
CollectedOutstanding
Student Strength & Capacity
Understand enrolment, available seats and occupancy across grades and campuses.
1,248
Primary 35%
Middle 28%
Secondary 25%
Higher Secondary 12%
Middle 28%
Secondary 25%
Higher Secondary 12%
Academic Progress
Review assessment results and subject trends to understand class performance.
Average ScorePass Percentage
Multi-Campus Comparison
Compare student strength, attendance and collection progress across campuses.
| Campus | Students | Attendance |
|---|---|---|
| Campus A | 1,248 | 92% |
| Campus B | 1,092 | 90% |
| Campus C | 752 | 88% |
Illustrative examples below. Dashboard availability and visibility depend on configured modules and permissions.
EDHI5 AIFrom Campus Data To
From Campus Data To
Intelligence And Action.
Add context to the numbers and surface patterns that deserve attention.
Signal
A change in attendance is surfaced for review.
Insight
Understand which class or period needs closer attention.
Suggested Action
Review the affected class and decide the next step.
Illustrative AI scenario. AI-assisted insights support human review and decisions.
Visibility With Responsibility
Relevant Information. Controlled Access.
Controlled Access
Show relevant information through role-based permissions.
Connected Records
Keep the campus context behind each dashboard available to authorised users.
Implementation Support
Configure views around your campus structure and team responsibilities.
Analytics & Dashboard Questions
Who Can Use EDHI5 Dashboards?
EDHI5 provides relevant views for management, principals and operational teams. Access is shaped by configured roles and permissions.
What Information Can The Dashboards Show?
Depending on the enabled modules, dashboards can bring together student strength, capacity, attendance, admissions, fees, academic progress and operational priorities.
Can Management Review More Than One Campus?
The supplied Management dashboard includes a campus selector and measures such as occupancy, staffing, attendance, fee collections and academic performance.
Are These Live Dashboard Screens?
The role previews are supplied product screens. The charts and figures on this marketing page are illustrative and are not connected to a live campus database.
Turn Campus Information Into Clearer Decisions.
Explore dashboards around your campus priorities and team responsibilities.